SHIPPING FEES
Free from 70,00 € (still 70,00 €)
from
5,90 €


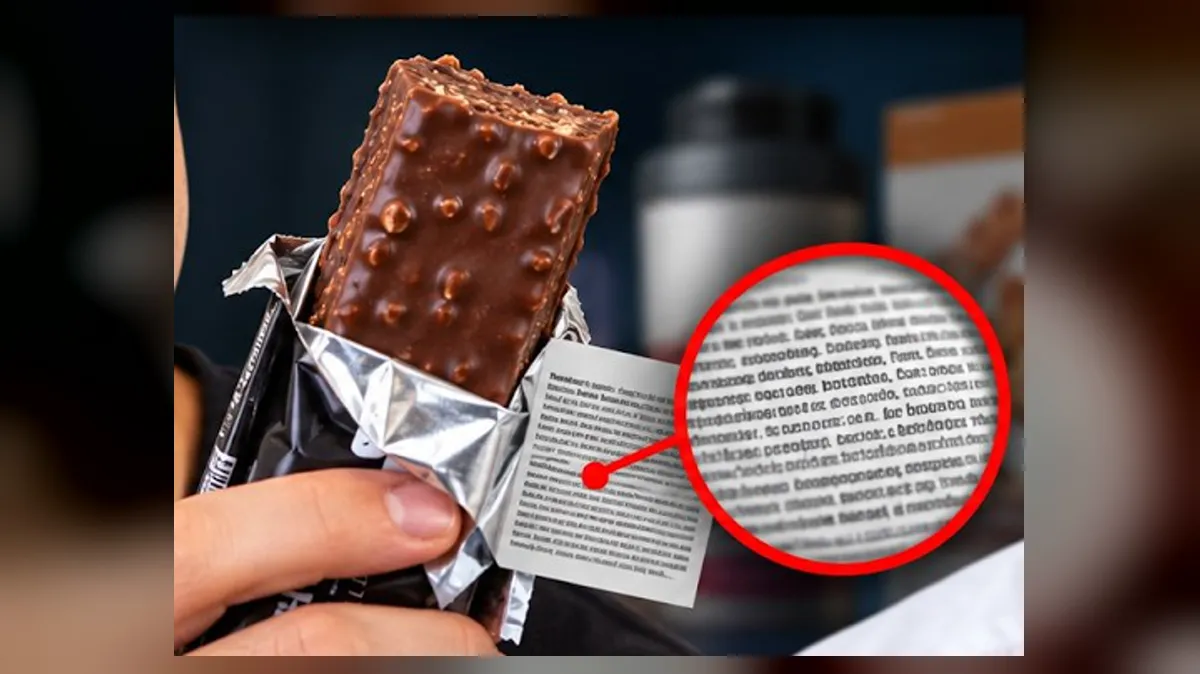
Yoghurts with 20 g of protein, “high protein” bars, drinks, cereals, even ready-made salads: the aisle has changed in just a few years. On 22 September 2026, an investigation by the French branch of the consumer group foodwatch put the subject back in the headlines, and you could quickly read that these products were a health risk. The protein in these foods isn’t the problem. The problem is everything around it: the sugar, the additive list, the price, and a number on the front that doesn’t always mean what you think.
You don’t judge a category by its worst products, any more than you judge cars by the worst ones on the road. What matters is knowing how to sort them in the aisle. Four checks are enough, and the tool below lets you test any label.
The short answer
A high-protein food is neither dangerous nor automatically good for you. Check the protein source, its amino acid profile, the real grams in the pack, then everything else: sugars, additives, price. The “high protein” claim only means that 20% of the product’s energy comes from protein.
foodwatch looked at the ingredient lists of 10 products marketed on their protein, sold in France, and classed them as ultra-processed under the NOVA system. The group points to markers such as modified starches, gellan gum, glucose syrup and isolated proteins, plus additives like carrageenan, acesulfame K and sucralose. [1] It also highlights sugar: 20.5 g per 100 g in a bar, 23 g in a cereal, and 9.1 g of sugars for 6 g of protein in 100 ml of a milk drink. And price: a “protein” salad cost €4 more per kilo than the regular version, for only 3.5 g more protein per 100 g.
Read properly, the report doesn’t say protein is dangerous. It criticises a halo effect: the word “protein” gives a product a healthy image that distracts from what’s in it. On that point, it’s right. “High in protein” can mean everything and nothing today. These manufacturers haven’t changed their minds about nutrition, they’ve changed their marketing: demand said “protein”, so the word appeared on the box, with a little in the product.
Where I part ways with it is the impression left behind: ten products picked from the least convincing don’t sum up a whole aisle. Broader data gives a more nuanced picture. A German study compared 585 ultra-processed products.
These figures don’t turn these products into health foods, and the study covers the German market. They show that, at a comparable level of processing, a protein product can be a nutritional step forward, at a high price. [2] A snack with 20 g of protein and little sugar still beats what those same shelves were selling fifteen years ago.
In the EU and Great Britain, the rules cover the claim “high protein” and anything likely to mean the same thing to a consumer. The threshold is 20% of the product’s energy coming from protein. “Source of protein” requires 12%. [3]
That threshold is relative, and this is where it all gets interesting. A very light drink with 2 g of protein and 30 kcal per 100 g gets 27% of its energy from protein, so it can be called high in protein. A 450 kcal bar with 10 g of protein, on the other hand, peaks at 9%: it’s a bar high in sugar or fat, whatever the packaging says. foodwatch makes the same point: the protein percentage can rise simply because fat has dropped, with no more protein in the product. [1]
Copy the numbers from the nutrition table for 100 g and the weight of the pot. The starting values describe a made-up yoghurt.
Calculation: proteins × 4 kcal ÷ product energy. Thresholds from Regulation (EC) No 1924/2006: 12% for "source of protein", 20% for "high protein". This tool reads a label, it does not judge the quality of the protein or the list of additives.
The aisle classic: in big letters on the front, “10 g of protein”. On the back, in smaller print, “per 100 g”. And the pot weighs 60 g. So you’re not getting 10 g of protein, you’re getting 6, about what you’d get from one egg, which costs around 30p.
The per-100 g table is mandatory, and the rules ban misleading information. [4] But it’s on you to do the conversion. Between two products with “20 g of protein”, the difference can be huge: one states it per serving, the other per 100 g. One relies on a plant source padded with amino acids, the other on an excellent amino acid profile. One contains very few additives, the other has more additives than protein.
In this order, with the pack turned over.
The details of each criterion are just below.
Not all grams of protein are equal, and the label doesn’t show it, because it doesn’t count proteins one by one. The figure is calculated from total nitrogen, multiplied by 6.25. [4] So anything containing nitrogen can end up in the total, including gelatine or a cheap amino acid. Your body won’t react the same way, though. When women averaging 69 years old took 30 g of whey or collagen twice a day for six days, only whey increased muscle protein synthesis over the trial. [5] It was a small sample, 22 people, and the result only applies to that group, but the difference is clear.
Depending on the source, some essential amino acids can run short. Plant proteins generally contain less methionine and lysine than animal proteins. [6] That doesn’t rule them out, it means a well-designed blend beats a single mediocre source. On a yoghurt or a bar, you’ll almost never find an amino acid profile, so the ingredient list is your best clue.
Read the per-100 g table and scale it to the real weight of the pot or bar. It takes ten seconds and defuses the front-of-pack trap.
Read the ingredient list in order: the first one weighs the most. If sugar comes before protein, you have your answer. Then compare sugars with protein in the table. Finally, watch out for added amino acids, which inflate the number on the label without providing real protein. This practice has a name: amino spiking.
It’s no coincidence, it’s formulation. When you push protein into a yoghurt, a dessert or a bar, the texture suffers: it turns dry and grainy, and hardens in storage. Fixing that takes texturisers, gums and modified starches. Protein often tastes bitter too, which gets masked with sweeteners and flavourings.
Some products don’t start from a good food with added protein. They start from a marketing idea that then has to be made edible. That doesn’t apply to every company: the size of a brand proves nothing either way. What counts is what its main goal is and what it does to get there.
It’s not my favourite sweetener, but “it contains acesulfame K, so it’s dangerous” is too simple. In France, the NutriNet-Santé cohort followed 102,865 adults: the highest consumers of acesulfame K had a 13% higher risk of cancer than non-consumers. [7] The same cohort found a link with type 2 diabetes. [8] These are observational studies: they raise a serious question without proving the sweetener is the cause, and their authors point out those limits themselves.
EFSA, for its part, re-evaluated this additive in 2025. It found no genotoxicity concern for acesulfame K and set its acceptable daily intake at 15 mg/kg of body weight, up from 9, noting that estimated exposures generally stay below that. [9] For a 70 kg person, that’s 1,050 mg a day. So it comes down to dose and frequency. If you’d rather avoid it, the ingredient list will tell you, and our stevia and sucralose comparison covers two other common sweeteners.
Not necessarily. The UK reference nutrient intake is 0.75 g of protein per kilo of body weight a day, or about 56 g for men and 45 g for women. [11] In France, foodwatch quotes official figures of 1.4 g per kilo a day on average, for needs of 0.83 to 1 g. [1][10] Many people already get enough without buying anything special. An athlete looking to build muscle aims higher, and you can run your own numbers with our protein calculator.
The real problem isn’t that the industry puts protein in everything. It’s that it sometimes uses the word to sell a poor product at a high price. Don’t be scared of high-protein foods. Learn to choose them like the rest of your shopping.
Not by nature. It depends on what else they contain and how much of your diet they make up. A high intake of ultra-processed foods is associated with several diseases, which is a good reason not to build your meals around them.
Both are regulated claims. “Source of protein” requires at least 12% of the product’s energy to come from protein, and “high protein” at least 20%.
Look at the protein per 100 g and the weight of the pot, then the sugars and the length of the ingredient list. Also compare the price per 10 g of protein with a plain yoghurt or skyr.
No product will make you lose weight on its own. A protein claim says nothing about the total energy in the product: check the calories per 100 g and the amount you actually eat. If you’re following a diet, ask a healthcare professional for advice.
Article based on Cyril Certain’s analysis, with a review of the sources cited. This content is for information only and does not replace advice from a healthcare professional.

You must be logged in to leave a comment.